Design
Compass: Facilitating metacognition in construction activities in K-16
classrooms
Ethan Danahy, ethan.danahy@tufts.edu
Center for Engineering Education and
Outreach, Tufts University
Morgan Hynes, morgan.hynes@tufts.edu
Center for Engineering Education and
Outreach, Tufts University
Ayelet Ronen, ayelet_ronen@mail.harvard.edu
Graduate School of Education, Harvard
University
Abstract
Design Compass is an educational tool
designed to facilitate learners’ metacognitive thinking during construction
activities. Learners record their progress through the engineering design
process by selecting the appropriate step in the Design Compass, which tracks
the amount of time spent on each step and presents this data to the learner in
the form of a histogram. A study was conducted to evaluate the usability of the
Design Compass. Participants recorded their process in the Design Compass while
working on a construction activity. Results suggest that the Compass is easy to
pick up and use and leads to more reflective thinking, but does not capture
multitasking by individuals or groups. Further revisions to the Design Compass
are discussed.
Keywords
Engineering, metacognition,
constructionism
Introduction: Constructionism
Constructionism can be thought of as
“learning-by-making” (Papert, 1980). Through the physical creation of
artifacts, learners engage with science content in a meaningful and authentic
way. Infusing hands-on construction activities into engineering curriculum can
increase learning and retention (Ortiz, 2010). The process of manipulating
materials in an effort to create artifacts provides opportunities for engaging
and motivating learners (Kolodner & Nagel, 1999).
In a typical construction activity,
learners have limited opportunities to reflect on their process. When learners
are asked to describe what they did at the completion of the activity, they
often struggle with accurately recalling what they did during the activity
(Crismond & Atman, in press). Some curriculum designers combat this by
scaffolding the design process for students (e.g., Learning By Design,
Engineering is Elementary); however, the majority of these efforts dictate the
process to the students rather than allow them to identify, on their own, how
they engage in the process. This bucks the constructionist philosophy that aims
to have students engage in personally meaningful exercises rather than rote,
pre-determined processes.
There is a missed opportunity here to
infuse metacognition into constructionist activities. Metacognition is the
monitoring of one’s own thinking (Flavell, 1979). Influsing metacognitive
opportunities into the design process allows students to reflect, debug and
systematize their processes, and is associated with the production of
higher-quality products (Adams & Atman, 2000).
The Design Compass as a Constructionist
Tool
Design Compass is an educational tool that
allows users to track their progress through the engineering design process
while working on a construction activity (Crismond, Hynes, & Danahy, 2010).
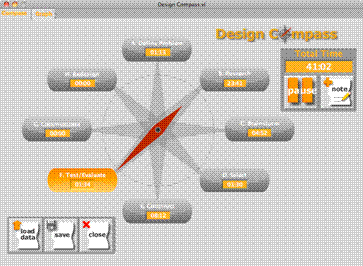
Figure 1. Compass (Main
View) of the Design Compass
The main screen, shown in Figure 1,
contains a timer that keeps track of the total time, as well as the steps of
the engineering design process (i.e. define problem, brainstorm, research,
etc.) (Massachusetts DOE, 2006). When a step is selected, the red arrow of the
compass points to that selected step, and a timer associated with that step
begins to keep time. Users are also able record notes and upload images.

Figure 2. Data View of the
Design Compass
The graph view displays a table with
cumulative data about the order of the steps and the time spent in each in
step. Data from the table is summarized in a histogram, which allows users to
compare the amount of time spent on each of the steps.
While learners work through an activity,
they are challenged to think actively about what step of the design process
they are on in order to report this in the Compass, as well as presented with
opportunities to capture their process in notes and images. After completing
the activity, learners are able to reflect using quantitative data.
Method
A study of the Design Compass was conducted
with five undergraduate students from various engineering disciplines. The
participants used the Design Compass while completing a constructionist
activity in which they needed to build a prototype of a one-handed jar opener
using LEGO bricks (Lemons, Carberry, Swan, Jarvin, & Rogers, 2010).
Participants had seventy-five minutes to brainstorm, research, and construct a
working model. To compare the use of Design Compass in a group with the use of
an individual, three of the participants were placed in a group and instructed
to work together on a single model, while the other two participants worked
individually on separate models.
Participants were asked to record their
steps on the Design Compass as they progressed through the activity. Data in
the form of video, screen capture, and Design Compass log files were collected
for each of the three groups. Participants were also asked to fill out pre- and
post-activity questionnaires.
Results
Results suggest that the Design Compass is
well suited for facilitating constructionist activities. A majority of
participants reported that the Design Compass is easy to pick up and use, and
all five reported that they reflected on their process more than they usually
do during a design activity.
In an attempt to assess how closely
participants’ reporting of steps matched with what they were actually doing,
video footage was compared with the Design Compass log files. The footage
showed that most of the work during the ‘Construction’ and ‘Test’ steps was
actually individuals multitasking (such as testing the durability of a material
while constructing) or rapidly switching between steps. In the case of the
three-person group, individuals within the group were working simultaneously on
different steps (see Figure 3).
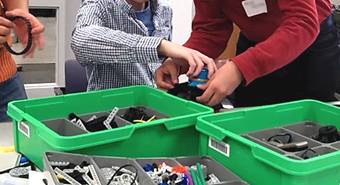
Figure 3. Group Members
Working on Different Steps Simultaneously
The individual on the left is examining and
testing out materials, while the individual in the middle is testing the device
and the individual on the right is constructing it.
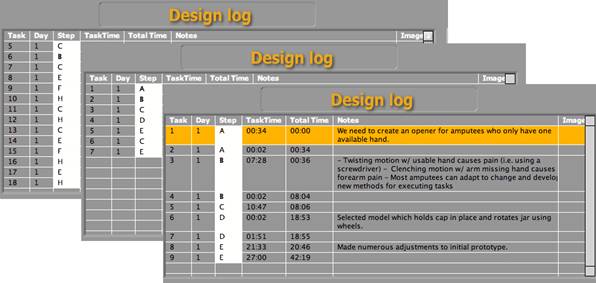
Figure 4. Comparing Log
Files Across Groups
A comparison of the three groups to each
other reveals that the three-person group worked more iteratively than did the
two one-person groups (see Figure 4). Evaluating the order of steps taken by
each of the groups shows that the three-person group (far left) completed
several iterations throughout the activity, while the two one-person groups
(middle, right) worked in a more linear fashion, completing at most two
iterations. Note: A: Define Problem; B: Research; C: Brainstorm; D: Select;
E: Construct; F: Test/Evaluate; G: Communicate; H: Redesign
Discussion
Results from this study suggest that Design
Compass can facilitate classroom interactions during engineering design
activities through the recording and viewing of quantitative data about steps
of the design process. Instructors can use the data to assess students’
progress through the design process and determine how to best assist students
with future activities. Following the completion of an activity, instructors
can facilitate discussion about variance in data between groups.
The Future of Design Compass
The results discussed above are informing
the interface and functionality of the next version of the Design Compass
currently in development. While including most of the same features and
capabilities, the second version will also have the following affordances:
1. Individual and Group Multitasking: Users will be
able to select multiple steps to work on at once and designate which group
member is working on which step if group members are working simultaneously on
different steps.
2. Resources: Instructors will be able to integrate
digital resources into the interface, such as images, videos, and text.
3. Customization: Instructors will be able to
customize the steps of the design process to align with local standards.
The revised Design Compass interface will
be more intuitive for use; an early mock-up is included (see Figure 5).
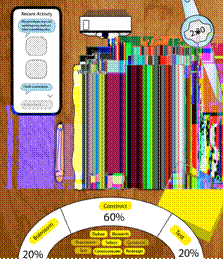
Figure 5. Early Mock-up of
Next Version of Design Compass
This design is intended to be easy for
users to pick up and use. Users drag steps into the dashboard arch to begin
tracking and adjust the percentages to designate the percent of their time they
are currently working on each of the steps. The watch in the top right keeps
track of the total time. By clicking on the pencil, users will be able to enter
text or draw sketches in the workspace. Behind the workspace are pages for resources
uploaded by the instructor and data visualizations of the user’s step data.
Users can click on the camera to take pictures.
Subsequent versions may include additional
features, such as optimization for mobile and touch-screen devices such as the
iPad, the ability to compare data across projects, and a physical device
References
Crismond, D. P., & Adams, R. S. (in
press). A Scholarship of Integration: The Matrix of Informed Design. Journal of
engineering Education.
Crismond, D., Hynes, M., Danahy, E. (2010).
The Design Compass: A computer tool for scaffolding students' metacognition and
discussion about their engineering design process. Paper presented at the
Association for the Advancement of Artificial Intelligence Spring Symposium,
Stanford University, CA.
Flavell, J.H. (1979). Metacognition and
cognitive monitoring: A new area of cognitive-developmental inquiry. American
Psychologist, 34 (10), 906-911.
Kolodner, J. L., & Nagel, K.
(1999). The Design Discussion Area: A Collaborative Learning Tool in Support
of Learning from Problem-solving and Design Activities. Paper presented at the
Computer Support for Collaborative Learning, Palo Alto, California.
Lemons, G., Carberry, A., Swan, C.,
Jarvin, L., & Rogers, C. (2010). The benefits of model building in teaching
engineering design. Design Studies, 31(3), 288-309.
doi:10.1016/j.destud.2010.02.001
Massachusetts DOE. (2006).
Massachusetts Science andTechnology/Engineering Curriculum Framework .
Massachusetts.
Ortiz, A. (2010). Fifth Grade Students’
Understanding of Ratio and Proportion in an Engineering Robotics Program.
Unpublished Dissertation. Tufts University.
Papert, S. (1980). Mindstorms:
Children, Computers, and Powerful Ideas. New York, NY: Basic Books.
Papert, S. (1991). Situating
Constructionism. In S. Papert & I. Harel (Eds.), Constructionism. Norwood,
N.J.: Ablex.
