MultiMap: A Computational Environment for
Supporting Mathematical Investigations
Wallace Feurzeig, feurzeig@bbn.com
BBN Technologies
Paul
Horwitz, phorwitz@concord.org
Concord Consortium
Abstract
MultiMap is a visual computational
environment expressly designed to support the learning and teaching of
mathematics. The MultiMap software transforms figures on the computer screen
according to transformations or mapping rules (i.e., maps) specified by the
user. The program enables students to design and experiment visually with maps
specified by mathematical functions, algebra formulas, and geometric
transformations and to investigate their properties and uses experimentally through
an extensive set of constructionist activities.
A Brief Overview of MultiMap
MultiMap has a direct manipulation iconic
interface with extensive facilities for creating maps and studying their
properties under iteration. The user creates figures (such as points, lines,
rectangles, circles, and polygons), and the program graphically displays the
image of these figures as transformed by the map, possibly under iteration.
MultiMap allows one to make more complex maps out of previously created maps in
three distinct ways: by composition, by superposition, or by random selection
of submaps. It includes a facility for coloring maps by iteration number, a
crosshair tool for tracing a figure in the domain to see the corresponding
points in the range, and a zoom tool for magnifying or contracting the scale of
the windows, MultiMap also enables the generation and investigation of
nonlinear maps that may have chaotic dynamics.
The program supports the creation of visual
figures that are often ornate and beautiful such as self-similar mathematical
objects of many kinds called fractals. The term “fractal”
designates the convoluted curves and surfaces that exhibit self-similarity at
arbitrary scales (Mandelbrot, 1983). Using MultiMap, with minimal
guidance from an instructor, students have discovered such phenomena as limit
cycles, quasi-periodicity, eigenvectors, bifurcation, fractals, and strange
attractors (Horwitz and Eisenberg, 1992).
The MultiMap screen is divided into three
windows as shown in the following figure. The user draws shapes such as points,
lines, and polygons in the Domain window, using the iconic tools shown in the
palette on the left. The computer draws the corresponding images of whatever
shapes are drawn in the domain. The Map window specifies the transformation of
points in the domain that “maps” them into the range. The user controls what
the computer draws in the Range window by specifying a mapping rule, expressed
in the form of a geometric transformation. The image specified by the map, drawn
on the Range window, is computed for the entire plane. In the figure, the user
has entered a rectangle in the Domain window and has then specified a map
composed of two submaps, a scale and a rotation. Scale (0.8, 0.8) scales the
rectangle to 0.8 of its original size in both x and y. Rotate (90 °) rotates
the rectangle 90 degrees about the origin. In a composition map such as this,
the transformations are performed in order. Thus the rectangle is scaled and
then rotated. This is an iterated map. The user has specified that the map is
to be performed 4 times with a distinct color for successive iterations (light
blue, green, red, and pink.) The Range window shows the result of the mapping.
|
|
 |
|
|
 |
Iterated Scale and Rotation Map
Using MultiMap, students from local high
schools created and investigated simple maps built on the familiar operations
of rotation, scaling, and translation. Students were introduced to rotation,
scale, and translation maps during their first sessions, and to their
properties under composition and iteration. They then investigated the behavior
under iteration of more-complex maps, including maps that produce beautiful
fractals with self-similar features at all levels, random maps that generate
regular orderly structures, and maps that, though deterministic, give rise to
unpredictable and highly irregular behaviors.
The program has a direct manipulation
iconic interface with extensive facilities for creating maps and studying their
properties. The simplest geometric maps are created from primitive operations
such as rotation, scaling, and translation. The user creates figures (such as
points, lines, rectangle, and polygons) and the program graphically displays
the image of these figures transformed by the map. The user also can specify a
mapping function algebraically. For example, the function X' -> X/2 , Y'
-> Y/2 will reduce figures to half their original size, and the
function X' -> X + 3 , Y' -> Y - 4 will translate figures three units
forward and four units down. MultiMap allows one to make more complex maps out
of previously created maps. For example, the two functions described above can
be composed (i.e., performed jointly) with the result shown below. As the
figure shows, the rectangle that is input to the Domain window is scaled to
half size and translated forward three units and down four units. The inset
from the MultiMap control window shows the specified mapping operations.


A user can repeat a mapping process an
arbitrary number of times to generate a sequence of images. For example, when
the mapping functions above are repeated four times in succession, the result
is shown in the following figure.
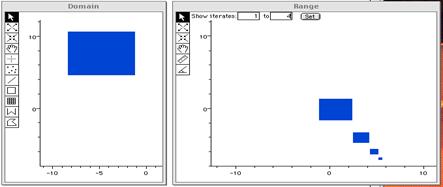
Iterated Scale and Translate
Map
As the figure illustrates, MultiMap can
display the limiting behavior of functions when they are iterated many times.
Only one of three things can happen: successive iterates of the function may
approach a single fixed point; they may converge to a limiting orbit of points;
or they may behave more erratically, never quite returning to a value they have
taken on before. Through investigating these situations, MultiMap can be used
to provide students a clear and accessible introduction to sequences and
limits, and a natural environment for investigating their behavior.
For example, students can create and
investigate geometric sequences such as the following. (Color is used in these
to show clearly the pattern of successive iterates, rather than for decorative
effect, though it does heighten the aesthetic aspect of the mathematical
structures.)

A Rectangular Spiral

A Triangular Branching
Pattern
MultiMap connects the algebraic and
geometric representations so that they are mutually supportive. The algebra
helps students' understanding of the geometry, and vice versa. The software
provides a variety of tools to aid exploration and investigation: a facility
for coloring maps by iteration number (as illustrated above), a crosshair tool
for tracing an input figure in the Domain window to generate the corresponding
image in the Range window, a zoom tool for magnifying or contracting the scale
of the windows, and a number of other tools to aid mathematical investigations.
The program facilitates the creation of self-similar figures, and allows one to
produce figures that are often very ornate and beautiful.
MultiMap enables students to engage in a
rich variety of mathematical investigations. Its visual representations
significantly aid in understanding function, iteration, algorithm,
transformation, model and other key mathematical concepts. We have piloted the
use of MultiMap with secondary students and teachers in algebra, geometry, and
computer science classrooms and teacher institutes. The program has been used
by over 50 math teachers who have demonstrated students' learning benefits and
mathematical empowerment from working with MultiMap. Teachers find it easy to
use and learn to write relatively complex programs. Through their work with
MultiMap, students find that doing and learning mathematics can be fun.
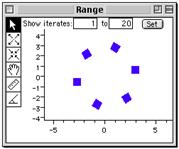
A Student Session
The following session illustrates the use
of MultiMap by two students, Kate and Fred, working together on an
investigation of rotational symmetry (Horwitz and Feurzeig, 1994). They began
by drawing a square and rotating it by 60 degrees, as shown on the left figure
below. They noted that the 6 copies of the square lay around a circle centered
at the origin, and that, though the map was iterated 20 times, after the first
6 iterations the others wrote over the ones already there. They were then asked
what the result of a rotation by 30 degrees would be. Kate said that there
would be 12 copies of the square instead of 6, no matter how many iterations.
They confirmed this, as shown in the middle figure. The instructor then asked
“What would happen if the rotation angle had been 31 degrees instead of 30?”
Fred said “There will be more squares—each one will be one more degree away
from the 30 degree place each time, so the squares will cover more of the
circle.” MultiMap confirmed this, as shown in the figure on the right
|
|
|
|
|
|
 |
|
 |
|
R(60) R(30)
R(31)
Instructor: “The picture would be less
crowded if the square was replaced by a point.” Fred made this change. The
result, after 100 iterations, is shown below on the left.
Since there was still some overlap, the instructor said “After
each rotation let’s scale x and y by .99. That will bring the rotated points in
toward the center a little more at each iteration.” Ann then built an
R(30°)S(0.99, 0.99) composite map. The effect of the scaling is shown below on
the right.
R(31) With
Points R(30)S(0.99, 0.99)
Fred: “Now the points come in like the
spokes of a wheel with 12 straight arms. The instructor then asked what
would happen if the rotation were 31 degrees instead of 30.
R (31) * S (.99, .99) R (31) * S (.99, .99) 12-color ramp
Fred replied “It would be almost the same
but the points would not be on straight lines. He tried this. The result is
shown on the left above. Kate said “The spokes have become spiral arms.” When
asked how many arms there were, she said “It looks like 12.” The instructor
said “Let's check that by making the points cycle through 12 colors repeatedly
so that successive points have distinct colors.” The result is shown above on
the right. Kate: “Oh, how beautiful! And now each arm of the web has the same
color.” Fred: “Right, and we can clearly see that the web figure has 12-fold
symmetry. Instructor: “What do you think will happen if the rotation is 29 degrees
instead of 31 degrees?” Kate: “I think it will be another spiral, maybe it will
curve the other way, counter-clockwise. But I think it will still have 12–fold
symmetry. Here goes!”
The result is shown below on the left.
Instructor: “Right! It goes counter-clockwise and it does have 12–fold
symmetry. Very good! Now let's try a rotation of 27 degrees. What do you think
will happen?” Kate: “I think it will be about the same, a 12–fold spiral
web, maybe a little more curved.” The result is shown below on the right.
R (29) * S
(.99, .99) 12-color ramp R
(27) * S (.99, .99) 12-color ramp
Instructor: “It might be that we don't
have enough detail—let's get a more detailed picture by changing the scale from
.99 to .999, and increasing the number of iterations from 300 to 600. See if
that makes a difference.” The result, after 600 iterations, is shown below
on the left. Kate: “Wow, it looks very different now! There are many more
than 12 arms, but they're all straight, and each arm still has many different
colors.” Instructor: “There's obviously much more than 12–fold symmetry
here. Any idea what it is?” Fred: “120.” Instructor: “Why do you
say that?” Fred: “Because 360 and 27 have 9 as their greatest common
divisor. So 360 divided by 9 is 40, and 27 divided by 9 is 3, and 40 times 3 is
120.” Instructor: “What do you think, Kate?” Kate: “I don't know
but I counted the arms and it looks like there are 40.” Instructor: “Let's
see if that's right. Reset the color map so that the colors recycle every 40
iterations instead of every 12 iterations.” 
|
|
 |
The students changed the color ramp. The result, after 600
iterations, is shown below on the right.
R (27) * S
(.999, .999) 12-color ramp R (27) * S (.999, .999) 40-color ramp
Kate: “Now each arm is the same color.
So there is 40–fold symmetry.” Fred: Is 120 wrong? Instructor: “No,
120 isn't wrong but it's not the only or the best answer. 240 and 360 would
work and so would any other multiple of 120. But the real question is: what is
the smallest one? The way to view the problem is this: what is the least number
of times you have to go around a circle in 27-degree increments to come back to
where you started? Or, to put it another way, what is the smallest integer N
such that the 27 times N is an exact multiple of 360? The answer is 40 because
40 times 27 equals 1080, which is 3 times 360. No integer less than 40 will
work.” Fred: “I understand. Now I can do the problem for any angle.”
Investigating the Mathematics of Fractals
and Chaos
We have begun to investigate the use of
MultiMap on a rich variety of topics including the mathematics of chaos,
fractals, and nonlinear systems. We seek to develop a coherent conceptual
framework for introducing the key ideas at a level appropriate for high school
presentation. To this end we are creating software tools designed to aid
students in carrying out mathematical experiments and explorations. These tools
will enable students to build and run models of dynamic systems with complex
behaviors, to see their effects unfold, and to manipulate and study the
generated graphic structures in multiple representations and at multiple levels
of detail. We have started to design learning activities centered on the use of
the tools and to develop organically the knowledge needed to use them
effectively.
We believe that a nontrivial introduction
to the ideas and methods of chaos can be developed and presented in a way that
is both accessible and compelling to a significant fraction of pre-college
students. This material is ideally suited to give students authentic experience
of what doing mathematics and science is really like in areas that are
meaningful and truly interesting to them. It provides rich opportunities for
successful mathematical exploration, inquiry, and discovery. We plan to
generate projects in relatively uncharted areas where it is possible for
students to make new findings. In introducing students to the concepts and
techniques of mathematical chaos we are placing them in a position to conduct
investigations in a manner quite analogous to that employed by professional
mathematicians.
Despite its modernity and complexity, an
introductory presentation requires little mathematics beyond high school
algebra. Moreover, the animated visual displays of chaotic processes greatly
facilitate understanding of the deep connection between chaos and fractal
geometry. The graphic pictures that are generated as natural outputs of
investigations are often breathtakingly beautiful objects in their own right —
the connection between mathematics and visual art has never been so apparent.
We introduce the subject of mathematical
chaos to students by first familiarizing them with three fundamental concepts:
iterated functions, maps, and fractals. Students then explore a wide variety of
applications of chaos, e.g., to classical mathematical problems such as finding
the roots of an equation; to the modeling of non-linear systems, such as the
growth and decline of animal populations, the spread of infectious disease, the
beating of the human heart, and the creation of fractal art and music. The use
of MultiMap enables students to gain insights from visually rich mathematical
explorations such as investigations of the self-similar cyclic behavior of the
limiting orbits of rotations with non-uniform scaling (Horwitz and Feurzeig,
1994) and a better understanding of the deep issues underlying the solution of
polynomial equations by generating maps that relate alternate representations
of mathematical universes such as quadratic polynomials (Feurzeig, Katz, Lewis,
and Steinbok, 2000).
The phenomenon of chaos is intimately
linked to the behavior of functions, often very simple ones, when iterated many
times. Only one of three things can happen: successive iterates of the
function may approach a single fixed point; they may converge to a limiting
orbit of points; or they may behave more erratically, never quite returning to
a value they have taken on before. In the last case the iterated function
sometimes displays an extremely sensitive dependence on initial conditions, so
that neighboring starting points, when operated on repeatedly by the function,
diverge very rapidly from one another, and all information about the starting
point is lost. Behavior characterized by such an extreme sensitivity to
initial conditions has been termed chaotic. The successive values taken on by
the function closely resemble a random sequence, and indeed chaotic functions
can be used as pseudorandom number generators. Because of their sensitive
dependence on initial state, mappings of chaotic functions often display nearly
self-similar structure on an infinitesimal scale, giving rise to curves and
surfaces of fractional dimension, or fractals.
Fractals depict the convoluted curves and
surfaces that exhibit approximate self-similarity at arbitrary scales
(Barnsley, 1983). They can represent realistic images of natural objects such
as flowers, clouds, and mountains. They can be amazingly complex and are often
very beautiful. Fractal structures can be thought of as having non-integral
dimensions. By virtue of its ability to generate recursive maps, MultiMap
becomes a kind of “Fractal Construction Set” that enables students to create,
modify and investigate fractals as objects of interest in their own right, even
before they discover the deep connection of fractals with the phenomenon of
chaos. For example, objects such as the fractal tree shown in the next figure,
the result after several iterations of building scaled (doubled) rotated copies
at each iteration, starting from the basic generating figure shown in the
Domain window.
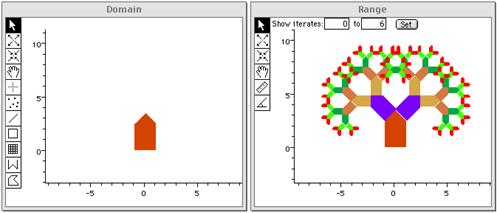
Generating a Fractal Tree
MultiMap
supports recursive maps. It can map window A onto window B and then map window
B back onto window A. This makes it a valuable tool for the study of iterated
functions. For example, students can use MultiMap to construct pictures that
contain "infinitely many" reduced copies of themselves. Such pictures
can be constructed simply by creating a reduced scale mapping from one window
to another, and then mapping the second window back onto the first,
appropriately positioned. The iteration of these “condensation maps” often
results in the creation of pictures that mimic such naturally occurring objects
as ferns and clouds (Barnsey, 1986). In addition to being inherently
interesting to students, these pictures illustrate the important idea of
invariance under a scale transformation — an idea that underlies the concept of
a fractal.
|
|
 |
The following two figures
illustrate the application of iterated maps for generation of fractal
structures in MultiMap. The first one shows the “Sierpinski gasket”, the
result after three iterations of building successively compressed and
three-fold multiplied copies of an embedded triangular pattern.
Sierpinski gasket
The generating figure, the initial iterate,
is the large red triangle. The first iterate comprises the three blue
triangles; the next two iterates are the nine orange triangles and the
twenty-seven green triangles.
From High School Algebra to Chaos
Iterated maps are also useful in
traditional mathematical activities, such as finding the roots of equations.
One such application is to Newton's method, a well-known iterative procedure
for locating the roots of equations in the complex plane. It can serve as an
alternative to the quadratic equation formula routinely taught in high school
algebra. It has the additional advantage that it can be generalized to finding
the roots of cubic and higher-order polynomial equations, and that it can be
motivated and justified to students via an appropriate graphical
representation.
We introduced Newton's method in the
context of quadratic equations, with which students were already familiar. We
presented it initially merely as an alternative to the usual, somewhat
mysterious formula. The method starts with an initial guess and then employs
the repeated application of an algorithm that ultimately converges on one or
the other of the two roots. We then posed the question: how does the choice of
the initial guess determine the future behavior of the process? In particular,
which of the two roots does the process ultimately converge on, and which
initial guesses, if any, will result in its never finding a root? To answer
this question, students began by using MultiMap to determine by trial and error
the regions in the complex plane for which starting guesses converge to one or
another of the roots of the equation.
For quadratic equations the solution is not
surprising: connect the two roots by a straight-line segment and construct the
perpendicular bisector of this segment. Then the “basin of attraction” of each
root (that is, the set of all initial points for which the method converges to
that root) is simply the open half plane on one or the other side of the
perpendicular bisector. Points on the bisector itself do not converge to either
root and in fact their behavior is chaotic, in the sense that the behavior
under iteration of neighboring points diverges very rapidly, so that all
information relating to the initial point is lost. In modern terminology, the
perpendicular bisector comprises the so-called Julia set of the iterated
rational function that characterizes Newton's method.
This new kind of exploration, in which one
asks about the behavior of an iterated function at each point in the complex
plane, requires a new kind of software tool — one capable of producing a
variety of new kinds of mappings. The most obvious mapping simply assigns a
different color to each pixel on the screen depending on the behavior of the
iterated function at the corresponding point on the complex plane. Thus, a
natural map of the situation described above is to color all points in the
basin of attraction of one of the roots of the quadratic equation red, say, and
of the other, green. This procedure divides the plane into two equal colored
regions, separated by a straight line.
We then show students how to generalize
Newton's method from quadratic to cubic equations, and give them the task of
mapping out the basins of attraction of each of the three (complex) roots.
Students expect the plane to be divided into three distinct regions,
corresponding to the basins of attractions of the three cubic roots, just as
the plane separated the basins of the two roots into two distinct regions for
the quadratic equation.
However, the resulting map behaves very
differently. It generates an extremely complicated and quite unexpected fractal
picture as shown in the following figure. The reason for such remarkable
behavior is simple. It can be rigorously shown that in the neighborhood of the
Julia set (that set for which the function “cannot make up its mind” which of
the three roots to converge to) there must be points belonging to each of the
three basins of attraction at any level of iteration. In geometric terms: coloring
the roots (say, red, green, and blue) at any point where any two regions (say
red and green) come together, the other (blue) region must meet both of them,
as well! There is no root-free boundary separating the regions. The structure is a fractal whose inner
structure is repeated at finer and finer scales. MultiMap can demonstrate this
strange phenomenon. Before representing the map, however, and after some consideration of this startling explanation of its
behavior, the user may well have come to the conclusion that this situation is
impossible. It is not, as the following figure depicting its behavior
shows.
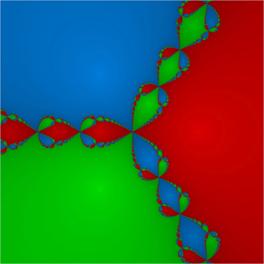
Cubic Roots Fractal
The observation of such astounding behavior
motivates an introduction to the study and investigation of mathematical chaos.
MultiMap provides users a powerful tool for experimental investigation of
chaotic maps, those where the sequence of points generated by iterating the map
exhibit “exquisite sensitivity” to initial conditions. (Horwitz and Eisenberg,
1992) describe and illustrate several such activities.
The properties of simple functions iterated
many times are wonderful, unexpected and beautiful, but they may be expected to
fall outside the set of inherently interesting topics for most high school
students. To someone for whom the solving of equations — even beautiful ones —
is not particularly motivating, the fact that this task can be accomplished
through iterating a simple function is unlikely to be of lasting interest. It
is important, therefore, to move on to activities in which the iteration of a
function implies something more than merely finding the roots of an equation.
An obvious choice, and one that has rich
mathematical and scientific applications, is to model a variety of processes
that evolve in time. Each successive iterate of the function may be taken to
represent a fixed time interval. If this interval is long enough to produce
significant changes in the variables the resulting equation is a finite
difference equation; if it is short on this scale, it approximated as a
differential equation. Without the computer and an accessible tool like
MultiMap, it would be unrealistic to attempt to introduce differential
equations to the high school mathematics curriculum. However, once one has
made a connection in students' minds between iterating a function and modeling
a time-evolving process, the transition becomes natural and compelling,
especially when introduced in the context of real-world situations such as
prey-predator interactions, the spread of contagious diseases, and
environmental recycling strategies. Many other areas of application are rich
candidates for student projects with MultiMap.
The development of MultiMap in the NSF
project “Advanced Mathematics from an Elementary Viewpoint” has been described
by Feurzeig, Horwitz, and Boulanger (1989). Early versions were implemented on
Macintosh desktop and laptop systems. We are currently implementing a new
version for tablet systems such as the Apple IPad together with an additional
body of project-based activities and supporting curricular materials.
References
Barnsley, Michael, 1986.``Making
Chaotic Dynamical Systems to Order'', in Chaotic Dynamics and Fractals,
Barnesley & Demko, eds. Academic Press, N.Y., (pp. 53-68).
Feurzeig, W., Katz, G., Lewis. P., and Steinbok, V. , 2000.“Two-Parameter Universes”, International
Journal of Computers for Mathematical Learning, Vol. 5, Nos. 2 and 3.
Feurzeig, W., Horwitz, P. and
Boulanger, A., 1989. “Advanced Mathematics from an Elementary Viewpoint: Chaos,
Fractal Geometrty, and Nonlinear Systems”, Book chapter in "Computers
and Mathematics", M.I.T. Press, Cambridge, MA.
Horwitz, P. and Feurzeig, W. , 1994,
“Computer-Aided Inquiry in Mathematics Education”, Journal of Computing in
Mathematics and Science Teaching, 13(3), 265-301.
Horwitz, P. and Eisenberg, M. , 1992,
“MultiMap: An Interactive Tool for Mathematical Experimentation”, Interactive
Learning Environments. Vol. 2, Issues 3 and 4, 141-179.
Mandelbrot, B., (1983), “The Fractal
Geometry of Nature”, Freeman, N.Y.


