Toward A Data Expression Toolkit:
Identifying the Elements of Dynamic Representational Competence in Young
Learners
Michelle Hoda Wilkerson-Jerde, michelle.wilkerson@tufts.edu
Department of Education, School of
Arts and Sciences, Tufts University
James Maldonis, james.maldonis@tufts.edu
Department of Education, School of
Arts and Sciences, Tufts University
Abstract
We report on part of an on-going project
to identify and support dynamic representational competence as a
constructionist competency for the 21st Century. Specifically, we seek to identify patterns in how young learners
construct visual representations of situations where quantities change over
time. We collected interview and written data from 7th graders as
they created representations of situations that featured simple, complex, and
statistical patterns of quantitative change. For these students, we found that representing
change involved 1) creating a static setting to provide context, 2) creating dynamic objects to indicate
what is changing, 3) shifting objects’ location or form to indicate
change over time, and 4) defining rules for how objects should respond to future
changes. This has implications for the teaching and learning of data/quantitative
literacy, and for the design of constructionist toolkits for representing data.
Keywords
Data science, metarepresentational
competence, dynamic systems, representation, inscription, visualization, computational
toolkits
Motivation and Vision
Advances in computational technologies have
increased our ability to collect, store, and manipulate information about the
world. As a result, educators have started to explore how we can help students
to develop new literacies related to data, statistics, and quantitative
reasoning, and to better understand the role of data collection, processing,
and manipulation in scientific practice. Often, this takes the form of engaging
students in collecting and analysing their own data using scientific probes,
publicly available data sets, and statistical analysis and visualization tools.
However, most such tools rely on established and emerging conventional
representations of data: few build upon the competencies young learners already possess for making sense of and expressing their understanding of the world with
data. These competencies are particularly important to foster in their own
right, both pedagogically and professionally as one seeks to explore or
articulate relationships and structures evident within data available for study
(Lehrer & Schauble, 2000; Collins, 2011; NSF, 2007). Therefore, our
long-term vision is to develop computational construction kits that allow
students to construct novel representations for live and complex data sets.
Toward this long-term goal, we are
currently exploring dynamic representational competence as one aspect of
the data sciences that best exemplifies a “constructionist competency for the
21st Century”. We use the term dynamic representational competence
to refer to students’ ability to design and interpret representations that 1)
describe quantitative situations that vary over time, or 2) utilize time as a
representational dimension (for example, use animation or interactivity to encode
covariational relationships). The term is derived in part from diSessa and
colleagues’ work on representational and metarepresentational competence in
children (diSessa et al, 1991; diSessa, 2004), which established that young
learners possess a wealth of resources for constructing and critiquing
representations of scientific and mathematical phenomena. We add the term dynamic to emphasize the new affordances that computational technologies provide for
capturing and representing temporal aspects of quantitative phenomena (Moreno-Armella,
Hegedus & Kaput, 2008). And, we also include in our definition a focus on
the role that different situational structures and relationships play in
students’ representational decision making – that is, in how students might
reach “beyond graphing” to communicate causal or structural aspects of a
situation (Collins, 2011).
In this paper, we characterize how 7th grade students construct and describe static (paper-and-pencil) representations
of dynamic situations. We use this as a way to identify beginning principles that
will guide the design of Constructionist tools for young learners to create computational
representations of such dynamic situations. Our ultimate goal is to create
flexible toolkits with which young learners can invent these computational
representations in order to explore and communicate trends in data they collect
from educational probeware, computational sensors embedded in tablet and mobile
devices, web-accessible data streams, and other data sources, share those
visualizations with others, and test their representations with new and
different sets of data.
Background
Our work is primarily and fundamentally
motivated by a Constructionist theory of pedagogy (Papert, 1980), which
emphasizes active construction of public artefacts for learning. In our case,
we are interested in developing an environment to support students in the construction
of computational data representation systems that can be shared, modified, and
tested with different data streams or sets. We take inspiration from
low-threshold data exploration environments such as TinkerPlots (Konold &
Miller, 2005) and Constructionist tools that allow students to flexibly
interface with sensors (Resnick et al, 2009; Sipitakiat, Blikstein &
Cavallo, 2004; Erwin, Cyr & Rogers, 1999). We seek to contribute to this
work a specific focus on dynamic representational and metarepresentational
fluency as a specific learning objective.
Our motivating theory of learning is that
students posses a wealth of experiential and intuitive “resources” – pieces of
knowledge for making sense of the world – and that the process of learning
involves establishing connections between resources that provide traction for
solving a problem or making sense of a phenomenon (e.g. Papert, 1996; Wilensky,
1991; Noss & Hoyles, 1996). Hence, if we are to develop a learning
environment to support dynamic representational competence, we much first
identify young learners’ existing strengths and approaches – what Bamberger
(1996) calls the “simplest elements” (p. 34) that young learners attend to when
constructing and describing their own representations of dynamic systems. The
identification of these “simplest elements” is the goal of the present paper.
Research Question
What
are the “simplest elements” (Bamberger, 1996, p. 34) that comprise students’
ways of constructing and describing representations of dynamic phenomena? By
“simplest elements”, we seek elements that will simultaneously:
1. Characterize patterns in how students construct
and communicate about representations.
2. Accommodate the diversity of normative and
non-normative representations students produce to express situations involving dynamic
quantitative change – including simple, complex, and statistical change.
3. Highlight points of intersection between
students’ normative and non-normative representational practices and constructions.
Methods
Our data sources include written classroom
work and semi-clinical interview data collected from students enrolled in one
of four seventh grade (age 12-13) classes at a diverse urban rim middle school
in the Northeastern United States. We took this complementary “depth and
breadth” approach in order to capture a diversity of students’ ways of
expressing dynamic situations, as well as to capture more detailed
complementary data regarding the processes by which students develop and
communicate about the representations they produce.
Both types of data were collected in the
context of a two-day unit on “Showing Science Stories”, developed in
collaboration with the students’ classroom science teacher Ms. Clemens. The activity was
completed in Fall of 2011 as an introduction to a physics unit on
position-velocity graphs. The students had not yet had formal instruction on
graphing during the school year in either their mathematics or science classes.
In the spirit of the design-based research paradigm (Cobb et al, 2003), we did
this in order to a) collect data that are true to how we might expect students
to engage with this material during a typical school day, and b) explore how
activities such as this can be integrated into existing curricula, since our
ultimate goal is to design tools for use in classroom settings.
The Classroom Activity: Showing Science Stories
Our written data comes from worksheets that
students completed during Day 1 of the two-day classroom activity sequence
entitled “Showing Science Stories”, led by Ms. Clemens. On Day 1, three
“Science Stories” (adapted from existing literature, see Table 1) were placed
on three different tables in the classroom. Students were split into groups of
2-3 students each, and each group was instructed to visit all three stations
and decide how to “Show the story:” on their worksheet.
Type |
Story |
Original
Source |
Direct |
A car
is speeding across the desert, and the driver gets very thirsty. When he sees
a cactus, he stops quickly to get a drink from it. Then he gets back in his
car and drives slowly away. |
diSessa,
Hammer, Sherin, & Kolpakowski, 1991
(p.
125) |
Emergent |
Scientists
are tracking a population of animals. For the first 15 years, the animals are
doing very well – every year more animals are born than the year before,
while the number of animals that die each year stays the same. However, after
15 years, a virus begins to spread through the population that makes it
harder for the animals to have babies. The number of animals that are born
each year gets smaller and smaller until there the same number of animals are
being born as are dying. |
Blanton,
Hollar & Coulomb, 1996
(p.
16) |
Statistical |
Some
children in Massachusetts grew some flower plants. Soon after the flowers
were first planted, they measured some of the plants to see how tall they had
grown. There were many measurements, but the shortest plant was 20 mm high
and the tallest was 80 mm. The children kept measuring the plants to track
how tall they grow over the summer. |
Lehrer
& Schauble, 2004
(p.
643) |
Table 1. “Science Stories” used for the classroom
activity and interviews
For each “Science Story”, the worksheet
also included three questions:
§ Why
did you show it this way?
§ What
information did you think of when you showed the story this way?
§ Do
you know of any other ways to show this story?
A
total of 46 worksheets were collected from students who consented to
participate in the study. The worksheets were scanned, organized in Filemaker
Pro for coding and analysis, and matched with corresponding student interviews
when appropriate.
The Interviews: Communicating Representational Choices
While Ms. Clemens’ class completed Days 1
and 2 of the “Showing Science Stories” activity, a total of 16 students (2
individual students and 7 pairs of students) also participated in more targeted
semi-clinical interviews (Ginsberg, 1997) with the first author, Michelle.
These students were identified with help from the classroom teacher as 1)
likely to express their ideas verbally, and 2) representative of the diversity
of socioeconomic, academic, and special education statuses of the larger class.
On Day 1, these students completed the “Showing Science Stories” activity as
part of the interview, on Day 2 they brought their completed worksheet to the
interview.
Each interview was video recorded using two
cameras to capture students’ paper-and-pencil inscriptions and their
interactions with the interviewer. The interviews lasted approximately 30
minutes and consisted of three phases. First, we asked students to show and describe
what they created for each story featured in the “Showing Science Stories”
activities, to discuss their representational choices, and to explain how they
would instruct a classmate to show a different version of the story in the same
way. Next, we asked each pair of students to create identical representations
of a new story (about tracking the heights of different members of a family
over time) without looking at one another’s productions – in an effort to
better understand systematicities in the way the young learners communicated
about the representational system as they created them.
Analysis and Results
We present our results in three sections.
First, we provide a general overview of the four “elements” of dynamic
representation that we identified in students’ descriptions and constructions
of dynamic representations: (1) a static setting, (2) objects to
represent quantities, (3) features of objects to indicate change, and
(4) rules of behaviour. While not all four of these elements played a
role for every student or every representation, we found that together they
highlight patterns in the ways students created and described their dynamic
representations, and accommodate the wide diversity of student productions in
the study. We exemplify these elements in the second part of our findings by
analyzing an in-depth example of an interaction between two students as they
decide how to represent variable changes in the height of four family members (two
children and two adults) over ten years. Finally, we provide evidence of these
four elements in students’ written work.
Part I: Defining the “Building Blocks” of
Dynamic Representation in Young Learners
We found four “elements” that together
characterize the diversity of ways that students described their
representations of dynamic systems as they constructed them, as well as
characterize specific features of their written productions. It is important to
note that we are not making claims that these four elements represent different types of knowledge, but instead that they describe ways in which
students differently attended to parts of their own representations. In this
section, we use our interview data to supplement these descriptions of each
element; Parts II and III include more detailed analyses.
Setting. Students
often described, and included in their productions, a static “setting” or
context-building scene. They described this setting as designed to help people
who will see the representation to interpret the broad context of the situation
within which quantitative change is taking place. For example, when we asked
students how they would show a new story in a similar way to a story they had
already represented (for example, how they would represent a new car story in a
way similar to their existing representations of car stories), several suggested
changing the setting to reflect a new context, while keeping other features the
same.
Objects. Students also described active “objects” that represented quantities of
interest within the representation. For example, multiple forms of cars,
animals, plants, or abstract icons such as circles or bars would be used to
represent quantities in the situation. Unlike the setting, students treated
objects as though their form or position would dynamically change as
corresponding quantities changed over time. Often, students explicitly labelled
these objects to set them apart from the setting.
Indicators of Change. Objects changed to represent changes in quantities of interest or changes
in time in a number of ways. Students would change an objects’ form (for
example, a plant would feature a bud to indicate earlier points in time and a
bloom to indicate later points, or a car might include fewer or more “motion
lines” to indicate changes in speed; see also Sherin, 2000), size (for example,
bars were described as increasing in height with increases in quantity), location
(for example, cars as well as bars or points on a graph, were described as
moving over time even if represented multiple cars, points, or bars describing
discrete points in time), or color.
Rules. Finally, some students included rules, usually in the form of sentences, which
indicated how objects should change in response to further changes in quantity
or time. While student’s explicit inclusion or articulation of such rules were
much more rare than settings, objects, and indicators, we include them as an
element because they reflect a way in which students can build toward
programming or training visualizations to dynamically respond to changes in
data.
Part II: Evidence from Interview Data
In this section, we highlight how the
elements we have identified “characterizes patterns in how students construct
and communicate about representations of dynamic phenomena (Research Question
1)”. We present a transcript of Irene and Alex, who are working together to
create a representation of a story in which a family of four – a mother,
grandfather, child, and baby – track their heights over ten years.

Figure 1. Irene and Alex
Setting the Scene. First, we see Irene and Alex negotiate what we are calling a setting:
the static organizational and contextual elements of their representation that
will help them define how objects within that setting that represent specific
quantities should behave, and that will help others interpret the meaning of
those behaviours. Irene proposes a conventional setting – a graph – but Alex
instead proposes creating a “wall corner”, which his family and many other
families use to track height over time.
[25:20.04]
Michelle: Ok, so this is how tall they
are to start and I want you to think about how to show the ways that their heights
change over the next ten years. So I'm going to put this up, but I want you
guys to show it the same way, so try to communicate with each other about how
you want to show the height.
Irene: Want to do like a graph for
every person? Say how many inches they grow every year, but we already
know that the mom has stopped growing.
Alex: Probably the grandpa. What my
family usually does is that we mark our heights on the corner of the wall and then we date it...
Defining the Objects. Once Irene and Alex have settled on the wall corner as an
organizational setting for their representation, they begin to negotiate the
initial placement of objects within that setting – which are implied to be
lines given the new context of height marks along the wall corner. Negotiating
this initial placement also helps Irene and Alex determine scale, which they
then use to determine later changes in the position of these objects over time.
[26:13.26]
Alex: so...there are lines down the
middle and then lines for all the other people with dates.
Irene: You could have the first one
be really tiny and say baby.
Alex: Well the baby is probably going
to grow really fast
Irene: But it probably won't grow big
fast like it will probably grow short in inches
Alex: I don't know...what year do you
think for the baby?
Irene: I think maybe 2000, that seems
pretty good...2000...and maybe the child will be twice the size of the baby.
Alex: Isn't it supposed to be taller
than the mom...I guess...
Irene: Oh yeah, so we'd have to bring
it up higher, so we could do...a little bit higher, but like a good size
higher...like an inch higher...and then they're all the same year at once...and then the mom would be like a centimeter under him, right?
Alex: Like four inches...2000...and
then the grandpa's the tallest?
Irene: Yeah, so he's like a high an
inch about the child.
Alex: Only a half an inch? Isn't that
only five foot five and a half? But I put him more towards the top, and then
we put the baby a little taller...
Indicating Change Over Time. Next, Irene and Alex use these relative positions of objects to
determine how those objects should change over time. Again, the setting has
already provided enough interpretive context for the representation that Irene
and Alex are both implicitly aware that objects shift only with respect to
relative height. In Figure 2, we see that Alex represented this shift on the
same “wall corner” line, while Irene drew a new wall corner to the left of the
original.
[00:28:20.11]
Irene: And then we do another line...
Boy: For the baby, 2 foot four?
Irene: Have that be...baby...2002?
Boy: And um, how tall?
Irene: It's like that...doubled
Boy: Four feet? And what year is it?
Irene: 2002...and then the mom
should stay the same...
Boy: So...just don't do anything...2000-2002
Irene: And then the child should be
like you know how we drew the grandfather right there...halfway there:
Boy: Alright...5 foot 8 inches?
Articulating A Rule. Finally, Irene decides that rather than creating a new line for
every two years, she can articulate a rule to describe how she expects the
situation will continue to change “for everyone” over the next ten years. While
the rule is articulated in terms of the situation itself rather than the
representation, her references toward “the distance they’re measured” and the
fact that the representation is “supposed to be charted until ten years” provide
some evidence that she is including this information as a proxy for subsequent
visual representations.
Irene: And then we'd have to do...we
would write everyone...
Boy: Wait, what are we writing:
Irene: So write everyone but
grandfather.. and mom grow two inches.. every year.. till how long?
[00:30:23.16] Irene: And then I wrote
"everyone but grandfather and mom grow two inches until ten years"...
Boy: That's what this is supposed to
show.
Irene: The distance they're measured
is between ten years, we only did two years
Boy: You can't really chart
growth...that's what this is supposed to show...
Irene: But we didn't show...she said in
the story they're supposed to be charted until ten years...
Boy: Ok...

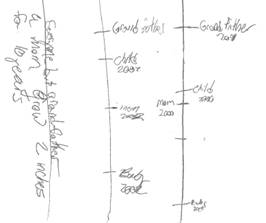
Figure 2. Alex’s (left) and
Irene’s (right) work after
creating representations of the family’s growth over time.
Part III: Evidence from Written Work
Although the elements we have identified
emerged from video data of students’ interactions with one another and the
interviewer, we have also found that they can be used to describe patterns
across a diversity of students’ written work (Research Objective 2). Below, we
include samples of student work that are representative of the diversity of
representations students produced for each story featured in the class
assignment, and highlight evidence that our focus on settings, objects, indicators and rules can accommodate that diversity. We then
report on more general trends throughout our entire corpus of data.
Direct Change: Car Story |

1 |

2 |
Emergent Change: Population Story |

3 |
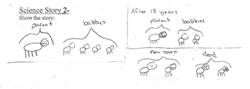
4 |
Statistical Change: Plant Story |
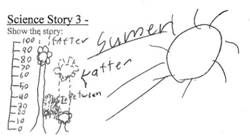
5 |

6 |
Table 1. Representative
Examples of Students’ Written Work
Using the elements we identified in Part I,
we can identify a variety of ways in which student productions (regardless of
their level of alignment with normative representations of each situation;
Research Objective 3) share a number of structural features.
Settings. The
time/distance planes in [1], desert scene featured in [2], segmentation of
space in [3] and [4], and axes featured in [5] and [6] all appear to serve the
role of setting, establishing the context for the story and indicating
how changes in focal objects should be interpreted (along which dimensions, and
for which purposes). In [2], [5], and [6] these settings are especially evident
because of their contrasts to elements of the representation that are shown the
be changing: for example, the multiple positions of the same car in [2], dotted
lines to indicate growth in [5], and arrows to indicate growth in [6].
Objects/Indicators. Points, circles, idealized figures, bars, are detailed drawings all
serve the role of object in different representations. These objects
change color [3], size [4, 5, 6], or position [1, 2] to indicate changes in
quantities of interest as outlined in the story. In all of the representations
featured here, only one object type is featured (that is to say, even though
each representation includes more than just one object, they are all the same:
multiple dots, bars, or animals for which only indicator features are changed).
Often, however, students included multiple objects to indicate change: for
example, a sun might be one object that becomes larger or its rays might become
longer to indicate the passage of time at the same time as different plant
objects indicate growth.
Rules. Though less common, some of students’ written productions also
articulated rules for how the representation (or represented story) accommodates
times not explicitly featured, or times in the future. In the featured set of
examples, [6] includes an explanation that the plants are expected to continue
to grow at a constant rate.
In our entire collection of 127
representations, we found that all but 26 representations included features
that we would associate with a setting. The average number of representations
students produced featured just under 2 objects/object types each. 18 included
verbalized rules for how the representation itself, or objects from the story
to which the representation is meant to refer, will behave at times not
explicitly featured.
Discussion
Computational technology has changed what
we can measure, and how we can show information. This, in turn, is placing new
demands on what is important to know about representational practice. We see dynamic
representational competence - that is, students’ ability to design
computational representations that include information about change over time
and feature animation and dynamism as a representational component - as an
important Constructionist competency entering the 21st Century. In
this paper, we take steps toward articulating patterns in the way that young
learners approach problems of dynamic representation, in an effort to inform
the design of construction kits that allow students to at once leverage these
intuitive approaches, while also reflecting upon and expanding their own
dynamic representational practice. The elements of dynamic representational
competence that we have identified show promise as a way to articulate the
structure of students’ representational choices while taking into account a
large diversity of situations that include dynamic quantitative change, as well
as normative and nonnormative student expressions of that change.
References
Bamberger, J. (1996). Turning music
theory on its ear: Do we hear what we see; do we see what we say? International
Journal of Computers for Mathematical Learning, 1(1), 33-55.
Cobb, P., Confrey, J., Disessa, A.,
Lehrer, R., & Schauble, L. (2003). Design experiments in educational
research. Educational Researcher, 32(1), 9-13.
Collins, A. (2011). Representational
competence: A commentary on the greeno analysis of classroom practice. In T.
Koschmann (ed.), Theories of learning and studies of instructional practice,
Explorations in the Learning Sciences, Instructional Systems and Performance
Technologies, 1. Springer: p. 105-111.
Cyberinfrastructure Council, National
Science Foundation. (2007). Cyberinfrastructure vision for 21st century discovery. March 2007. Washington, DC: National Science Foundation.
DiSessa, A., Hammer, D., Sherin, B.,
& Kolpakowski, T. (1991). Inventing graphing: Meta-representational
expertise in children. The Journal of Mathematical Behavior, 10(2),
117--160.
Erwin, B., Cyr, M. & Rogers, C.
(1999). LEGO Engineer and RoboLab: Teaching engineering with LabVIEW from
kindergarten to graduate school. International Journal of Engineering
Education, 16(3). p. 181-192.
Ginsburg, H. (1997). Entering the
child's mind: The clinical interview in psychological research and practice. Cambridge University Press.
Konold, C., & Miller, C. (2005).
TinkerPlots: Dynamic data exploration. [Computer Software] Emeryville, CA:
Key Curriculum Press.
Lehrer, R., & Schauble, L. (2000).
Modeling in mathematics and science. Advances in Instructional Psychology, 5,
101-159.
Moreno-Armella, L., Hegedus, S. J.,
& Kaput, J. J. (2008). From static to dynamic mathematics: Historical and
representational perspectives. Educational Studies in Mathematics, 68(2),
99-111.
Noss, R., & Hoyles, C. (1996). Windows
on mathematical meanings: Learning cultures and computers. Springer.
Papert, S. (1980). Mindstorms:
Children, Computers, and Powerful Ideas. New York, NY: Basic Books.
Resnick, M., Maloney, J.,
Monroy-Hernández, A., Rusk, N., Eastmond, E., Brennan, K., Milner, A.,
Silverman, B. (2009). Scratch: Programming for all. Communications of the
ACM, 52(11), 60-67.
Sipitakiat, A., Blikstein, P., &
Cavallo, D. P. (2004). GoGo board: Augmenting programmable bricks for
economically challenged audiences. Proceedings of the 6th International
Conference on Learning Sciences, 481-488.
Wilensky, U. (1991). Abstract
meditations on the concrete and concrete implications for mathematics
education. In I. Harel & S. Papert (Eds.), Constructionism.
Norwood, MA: Ablex Publishing. pp. 193-203.
