Supersonicman – an informatics x physics project
Jan Benacka, jbenacka@ukf.sk
Dept of Informatics, Constantine the Philosopher University in Nitra, Slovakia
Abstract
In the paper, a student project is
proposed where high altitude fall of a person in the air is investigated. The object
is to answer the question if it is possible to reach supersonic speed.
Keywords
Constructivism, spreadsheet, model, Kittinger,
fall
Introduction
In the paper, a project for grammar school student
(age 17-19) is proposed where high altitude fall of a person in the air is
investigated. The object is to answer the question if it is possible to reach
supersonic speed. An interactive numeric model of J. W. Kittinger's
legendary jump is created in Excel, based on the Euler's method which is clear
and intelligible. No programming is used. Using the model, students can
investigate the behaviour of the system and find the boundary or limiting
cases. The project meets well the UNESCO's
notion about ICT in secondary school (Anderson, 2002). It corresponds with
3 out of the 11 units of the module "Application of ICT in subject
areas", which are: ICT in Natural Sciences, Modelling and Simulation, and
Spreadsheet Design. The project is based on author's article (Benacka, 2011). Ideas
for other cross subject projects (informatics x physics, informatics x
mathematics) can be found in (Benacka, 2007, 2008, 2009, 2011b). The minimal
ICT tools that the students will use in the project are: Internet to find the sources; word processor to write up the report; PowerPoint, to prepare the
presentations, and spreadsheets as the key tool to develop the model. The choice of the spreadsheet
is obvious – it is a widespread program that enables students to analyse
scientific problems and find solutions without programming. Not only is it easy
to use, but it allows using problem-solving and heuristic methods, which are
close to talented pupils. While creating the model, students practise their
spreadsheet skills, gain new ones, and get a better understanding of the
modelled problem. This makes spreadsheet an excellent tool for constructivist
learning.
High-altitude fall in the air
On August 16, 1960, USAF Captain (later
Colonel) Joseph W. Kittinger carried out his legendary jump from the helium balloon
Excelsior III at the altitude of 31,300 m. He reached the top speed of 274 m/s, which was 0.9 of the speed of sound at the altitude. His mass was 142 kg, from which 70 kg was gear. He fell as sitting in an armchair due to his inflated pressure
suit. He had serious breathing difficulties between 27,400 m and 21,300 m due to the helmet that was pressing against his throat (Kittinger, 1960; URL 1). It has been
the highest, longest, and fastest sky-dive ever made. According to some sources,
the top speed was 319 m/s (Clash, 2003). That would be a supersonic
fall at the altitude. Some time ago, an attempt was cancelled to break the
sound barrier in fall (Tierney, 2010). The jumper was to fall in a special
suit, head-to-earth, stabilized just with his legs and arms straighten back in
a "V" shape. There is a question: Is it possible for a person
falling in the air to reach supersonic speed, that is, to become a Supersonicman?
US Standard
Atmosphere is a scientific atmosphere model (URL 2). The properties are in Tab.
1.
Layer
b |
Altitude (km)

|
Density
 (kg/m3) (kg/m3)
|
Temperature
 (K) (K)
|
Temperature
lapse
rate  (K/m) (K/m) |
Speed of
sound
 (m/s) (m/s)
|
Name |
0 |
0 – 11 |
1.225 |
288.15 |
–0.0065 |
340.29 |
Troposphere |
1 |
11 – 20 |
0.36391 |
216.65 |
0 |
295.07 |
Stratosphere |
2 |
20 – 32 |
0.08803 |
216.65 |
0.001 |
295.07 |
Table 1 US Standard Atmosphere 1976 up to 32 km
Values  ,
,  , and
, and  hold at bottom
  of layer b. Temperature
lapse rate is constant within layer b. In layers b = 0 and b = 2, density
of layer b. Temperature
lapse rate is constant within layer b. In layers b = 0 and b = 2, density  is given by the equation
 , (1)
, (1)
where  ,
,  is the gas constant,
  is the molar mass of the
air, and z is the altitude, where
is the molar mass of the
air, and z is the altitude, where  . Remark: In layer
  , which is out of the
interest, the density is
, which is out of the
interest, the density is  .
Speed of sound
.
Speed of sound  is given by
the equation
is given by
the equation
 . (2)
. (2)
Acceleration due to gravity at sea level is  m/s2. The
acceleration at altitude z is
m/s2. The
acceleration at altitude z is
 , (3)
, (3)
where  m is the effective radius
of the Earth.
m is the effective radius
of the Earth.
Weight  and drag
  (Marion, 1970) act on a
body of mass m falling in the air, where
(Marion, 1970) act on a
body of mass m falling in the air, where  is the maximum
cross-section area of the body perpendicular to the motion direction,
is the maximum
cross-section area of the body perpendicular to the motion direction,  is the air density, v is the speed, and C is the drag coefficient dependent on the shape of
the body. If the speed is subsonic (below about 0.8 of sonic speed = Mach 0.8),
then C is virtually constant. If the speed is transonic (from Mach 0.8
to 1.2), then C increases rapidly. The resulting force F is
is the air density, v is the speed, and C is the drag coefficient dependent on the shape of
the body. If the speed is subsonic (below about 0.8 of sonic speed = Mach 0.8),
then C is virtually constant. If the speed is transonic (from Mach 0.8
to 1.2), then C increases rapidly. The resulting force F is
 . (4)
. (4)
It holds that  , where
  is acceleration and t is time. Substituting in Eq. (4) gives
 , (5)
, (5)
where  , and n is the
number of subintervals of interval
, and n is the
number of subintervals of interval  . It
holds that
. It
holds that  . It holds at
  that
that  m/s and
  . Then, speed
  and altitude
  are given by the
equations
are given by the
equations
 ,
,  ,
,  , (6)
, (6)
 ,
,  , . (7)
Equations (6) and (7) allow graphing the
speed and altitude.
Implementing the model in Excel
The application is in Fig. 1. The graph is
made over 5,000 points. The white cells are for inputs.
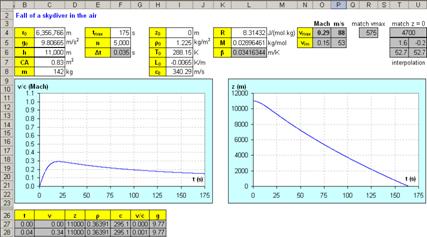
Figure 1. Speed and altitude of a
person falling in the troposphere:
h = 11, 000 m, CA = 0.83 m2,
m = 142 kg,  = 88 m/s = Mach
0.29
= 88 m/s = Mach
0.29
Instead of C and A, product CA is inputted (see
the next section). The grey cells contain formulas. In cell F6, it is =F4/F5. In L6, it is =C5*L5/L4. The model is
in cells B27:H5027. They contain the following formulas (copied down as far as
row 5027; the number of the equation is added):
B27
=0; C27 =0; D27 =C6
E27
=$I$5*(1+$I$7*(D27-$I$4)/$I$6)^(-$L$6/$I$7-1) (1); F27=$I$8*SQRT(1+$I$7*(D27–$I$4)/$I$6)
(2) G27=C27/F27; H27 =$C$5*($C$4/($C$4+D27))^2 (3);
B28 =B27+$F$6; C28
=C27+(H27-0.5*$C$7/$C$8*E27*C27*C27)*$F$6 (6); D28 =D27–C28*$F$6 (7)
The maximum of relative speed  is in cell O4 found by function MAX(G27:G5027). In cell R4, function MATCH(O4;G27:G5027;0) returns the ordinal number of the maximum. In cell P4, function OFFSET(C26;R4;0;1;1) returns the value in the cell shifted from C26 downwards by the
number in cell R4, i.e., it returns the speed from the row where the maximum
relative speed is.
is in cell O4 found by function MAX(G27:G5027). In cell R4, function MATCH(O4;G27:G5027;0) returns the ordinal number of the maximum. In cell P4, function OFFSET(C26;R4;0;1;1) returns the value in the cell shifted from C26 downwards by the
number in cell R4, i.e., it returns the speed from the row where the maximum
relative speed is.
The impact speed is calculated in cells T4:U6.
In cell T4, function MATCH(0;D27:D5027;–1) gives the ordinal number of the null or last positive altitude (from D27
downwards). In cell T5, function OFFSET(D26;T4;0;1;1) gives the altitude. The next altitude is returned into cell U5 by function OFFSET(D26;T4+1;0;1;1). Thus, cells T5 and U5 contain the last nonnegative and the first
negative altitudes. In cells T6 and U6, functions OFFSET(C26;T4;0;1;1) and OFFSET(C26;T4+1;0;1;1) give the
speed from these rows. The impact speed, which is the speed at null altitude,
is calculated in cell P5 using linear interpolation by the formula =T6–(T5–0)/(T5–U5)*(T6–U6). There is no sense to calculate the impact speed in the
stratosphere (Figs. 2, 3).
Analysis of the fall
The application with the data for Kittinger's
jump is in Fig. 1. Parameter CA was iterated until the maximum speed was
274 m/s, which gave CA = 0.83 m2. It holds for a
person that  (URL 3). Kittinger fell
as sitting in an armchair with load on his back. If
(URL 3). Kittinger fell
as sitting in an armchair with load on his back. If  , then
  , which is acceptable
Kittinger was in transonic range (above Mach 0.8) for 28 s from t = 29 s
to t = 57 s. If C increased during this flight to
, which is acceptable
Kittinger was in transonic range (above Mach 0.8) for 28 s from t = 29 s
to t = 57 s. If C increased during this flight to  , then
  , which is still acceptable.
This version of the fall is plausible.
, which is still acceptable.
This version of the fall is plausible.
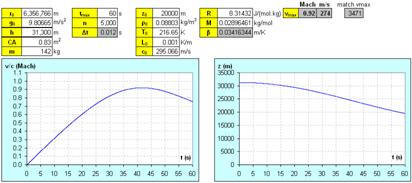
Figure 2. Speed and altitude of a
person falling in the stratosphere:
h = 31,300 m, CA = 0.83 m2,
m = 142 kg, = 274 m/s = Mach
0.92
It is clear from Fig. 3a that reaching maximum
speed of 319 m/s (Mach 1.08) is possible if CA = 0.46 m2.
If , then A = 0.46 m2,
if  , then A = 0.38 m2 and if , then A = 0.35 m2.
The values of A are too small. It is impossible that Kittinger could
reach this speed.
, then A = 0.38 m2 and if , then A = 0.35 m2.
The values of A are too small. It is impossible that Kittinger could
reach this speed.

Figure 3. Speed and altitude of a
person falling in the stratosphere: h = 31,300 m, m = 142 kg,
(a) CA = 0.46 m2, = 319 m/s = Mach
1.08, (b) CA = 0.62 m2, = 296 m/s = Mach
1
Fig. 3b shows that sonic speed (Mach 1)
could only be reached if CA = 0.62 m2. If , then A = 0.62 m2,
if , then A = 0.52 m2 and if , then A = 0.48 m2.
Also these values of A are too small for the Kittinger's way of fall.
Suppose Kittinger would fall head-to-earth,
arms and legs straiten back, and with well-shaped load. It holds that  for such a system at
subsonic speed, so is possible at
sonic speed. The corresponding area A = 0.62 m2 is acceptable (Fig. 3b). If m = 100 kg, then the model
gives CA = 0.43 m2; if then A = 0.43 m2,
which is still acceptable. Thus, reaching sonic speed is possible. The question
is whether the jumper would survive. Kittinger had serious breathing
difficulties from 27,400 m to 21,300 m because of the helmet that was pressing against his throat. Fig. 2, right side, shows that it was from t = 29 s
to 57 s. Fig. 2, left side, shows that Kittinger was just in the transonic
range, that is, above Mach 0.8. Then, "Parts of your body may be going
supersonic while others aren't, causing flutter waves pulling back and forth …
that knocks him out of control" (Tierney, 2010). This turbulence caused tragic
plane crashes when breaking the sound barrier at the end of forties. The
problems with the helmet could not have been caused by anything else.
for such a system at
subsonic speed, so is possible at
sonic speed. The corresponding area A = 0.62 m2 is acceptable (Fig. 3b). If m = 100 kg, then the model
gives CA = 0.43 m2; if then A = 0.43 m2,
which is still acceptable. Thus, reaching sonic speed is possible. The question
is whether the jumper would survive. Kittinger had serious breathing
difficulties from 27,400 m to 21,300 m because of the helmet that was pressing against his throat. Fig. 2, right side, shows that it was from t = 29 s
to 57 s. Fig. 2, left side, shows that Kittinger was just in the transonic
range, that is, above Mach 0.8. Then, "Parts of your body may be going
supersonic while others aren't, causing flutter waves pulling back and forth …
that knocks him out of control" (Tierney, 2010). This turbulence caused tragic
plane crashes when breaking the sound barrier at the end of forties. The
problems with the helmet could not have been caused by anything else.
Fig. 1 shows a hypothetical Kittinger's
fall from 11 km where the troposphere ends. Passenger airplanes cruise at
this altitude. The maximum speed is 88 m/s, which is
just Mach 0.29. To reach 100 m/s, it has to hold
that CA = 0.62 m2. If m = 100 kg,
then the model gives CA = 0.44 m2.
Conclusion
The project shows the great possibilities
that spreadsheet offers for studying school subjects. The facts in section 2
are additional to physics curriculum, Eqs. (1) – (3) show using higher functions
in practice. Calculating the impact speed is an example of getting a value that
is not in the cells by interpolation using the values returned by functions MATCH
a OFFSET. They are important for those who will use Excel for modelling in
science, engineering, business, etc. The analysis is an example of scientific argumentation
to find the solution. The result is: A person falling in the air can reach
supersonic speed if he falls in the stratosphere from the altitude of about 32 km head-to-earth. Surviving is doubtful. In the troposphere, the maximum speed is about 100 m/s.
Acknowledgement
The author is a
member of the research team of project PRIMAS (Promoting Inquiry in Mathematics
and Science Education across Europe) funded by the EU 7th Framework
Programme, grant agreement 244380.
References
Anderson,
J. et al. (2002). Information and Communication Technology in Education,
Curriculum for School and Programme of Teacher Development. UNESCO [online]
[cit. 2011-08-19]. Available on Internet: <http://unesdoc.unesco.org/images/0012/001295/129538e.pdf>.
Benacka, J. (2007). Spreadsheet Numerical Modeling in Secondary
School Physics and Biology.
Spreadsheets in Education, 2 (3) [cit. 2012-02-27]. Available
on Internet:
<http://epublications.bond.edu.au/ejsie/vol2/iss3/3>.
Benacka, J. (2008). 3D Graphics with Spreadsheets. Spreadsheets in
Education, 3 (1) [cit. 2012-02-27]. Available on Internet: <http://epublications.bond.edu.au/ejsie/vol3/iss1/7>.
Benacka, J. (2009). Simulating Projectile Motion in the Air with
Spreadsheets. In M. Lau, & S. Sugden (Eds.), Spreadsheets in Education,
3 (2) [cit. 2012-02-27]. Available on Internet:
<http://epublications.bond.edu.au/ejsie/vol3/iss2/3>
Benacka, J. (2011). Solving J. W. Kittinger’s Jump in Excel. Spreadsheets
in Education, 5 (1)
[cit.
2012-02-27]. Available on Internet: <http://epublications.bond.edu.au/ejsie/vol5/iss1/1>.
Benacka, J.
(2011b). School mathematics with Excel. Applications of Spreadsheets in
Education: The Amazing Power of a Simple Tool. Sharjah : Bentham Science
Publishers.
Clash, J. M. (2003). One giant step. Forbes, December 08 [cit. 2012-02-27]. Available on Internet:
<http://www.forbes.com/global/2003/1208/060.html>.
Kittinger,
J. W. (1960). The long, lonely leap. Natl. Geogr., 118 (6), 854-873.
Marion, J.
B. (1970). Classical dynamics, 2nd ed. New York: Academic.
Tierney, J. (2010). A supersonic jump, from 23 miles in the air. The New York Times. March 15
[cit.
2012-02-27]. Available on Internet: http://www.nytimes.com/2010/03/16/science/16tier.html>.
[URL 1] Fastest Skydiver Joseph Kittinger. Aerospaceweb [cit. 2012-02-27]. Available on Internet:
<http://www.aerospaceweb.org/question/aerodynamics/q0243.shtml>.
[URL 2] US
Standard Atmosphere 1976. Washington D.C. October 1976 [cit. 2012-02-27]. Available on Internet:
<http://ntrs.nasa.gov/archive/nasa/casi.ntrs.nasa.gov/19770009539_1977009539.pdf>.
[URL 3] Drag Coefficient. The Engineering Toolbox [cit.
2012-02-27]. Available on Internet:
http://www.engineeringtoolbox.com/drag-coefficient-d_627.html>.
